
Bitcoin has touched the 200-day moving average – a rare event, for sure, that has historically resulted in a bounce (other than in 2022 when it spent the best part of a year drifting sideways).
Are we back in the same territory?
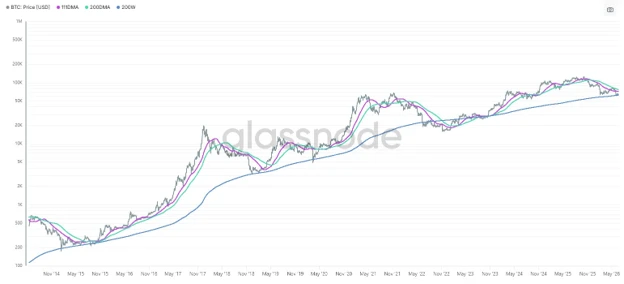
Why traders watch this line
Traders and investors watch the 200-week moving average closely because it acts as a major support level in bull markets (price tends to bounce when it touches it), or resistance in bear markets (price often struggles to break above it).
When price crosses above or below the 200-day MA, it often signals a significant trend change.
What happened the last three times
Historically, this is what happened when the 200 day moving average was hit:
· In the 2018 bear market, BTC broke through the 200-day MA and this was followed by a 80%+ crash.
· In 2022, a decisive breakdown below this line marked the start of a prolonged winter.
· In contrast, during the 2024–2025 bull run, BTC repeatedly used the 200-day MA as strong support and bounced higher.
The big question now is whether the 200-day MA will hold as support or fail. A clean break lower could open the door to a more significant correction, while a bounce would suggest the bull market remains intact.
Fear and Greed
Fear and Greed
The Fear and Greed index – measuring six different metrics from market momentum to volatility and market dominance – is ridiculously low at 17.
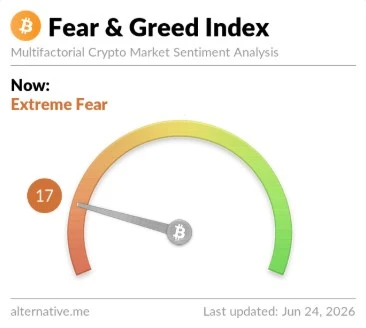
It cannot go much lower. In the past this level of extreme fear has been a good buying opportunity. This is more evidence that bitcoin is forming a bottom at current levels, though don’t expect the next bull market to kick in just yet.